This chapter is for deciding whether the backend fits a service, and for putting it into production once it does: what it costs in time and memory compared with the alternatives, how the binary ships, and the limits worth knowing first.
What it costs
Same handler, three ways, plus Go for an outside reference. Two pinned cores, 64 connections, medians of three interleaved runs on the plaintext route:
| Runtime | Requests/sec | p50 | p99 | Cold start |
|---|---|---|---|---|
Codename One native, musl | 595,610 | 0.090 ms | 0.249 ms | 0.77 ms |
Codename One native, glibc | 547,761 | 0.065 ms | 4.06 ms | 2.88 ms |
Go, fasthttp | 496,293 | 0.104 ms | 2.63 ms | 2.39 ms |
The same handler on the JVM | 187,745 | 0.260 ms | 1.60 ms | 82.5 ms |
Cold start is the interesting column. It’s measured from process spawn to the first accepted connection, and the static binary reaches it in under a millisecond — about a hundred times faster than the same code on a JVM, and three times faster than Go. That number is the whole serverless argument.
Throughput is the least interesting one. Beating a tuned Go server by a fifth on a microbenchmark isn’t a reason to move a service; it’s only evidence that the translation doesn’t cost you anything.
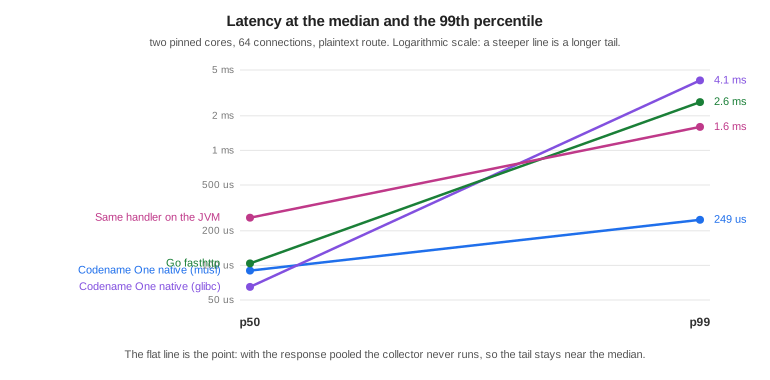
The slope chart is the one that matters. Every runtime here has a similar median. What differs is the distance to the 99th percentile, and that distance is garbage collection. With the response pooled the plaintext route allocates about 0.1 bytes per request, the collector never runs, and the tail stays at 2.8 times the median. Give the same server a handler that allocates a map per request and its tail goes to 80 ms, because the collector shares the cores with the server.
The honest rule is that the tail follows your allocation rate, not the runtime badge. The runtime gives you the tools to allocate nothing on the hot path; it doesn’t do it for you.
Memory and size
| Runtime | Binary or artifact | Resident under load |
|---|---|---|
Codename One native, musl | 7.95 MB static | 10-40 MB |
Codename One native, glibc | 3.19 MB dynamic | 14 MB |
Go, fasthttp | 5.63 MB static | 6.3 MB |
The same handler on the JVM | 0.13 MB jar, plus a JRE | 190 MB |
The JVM row is the same handler and the same protocol code. Everything it costs above the native rows is the runtime underneath it.
The resident figures move around more than the latency ones, because the collector keeps a pool of pages sized to the busiest moment the process has seen and gives them back gradually. At rest the native builds sit near 3 MB.
musl or glibc
Both are supported, and they aren’t equivalent. The static musl build starts faster and has a far shorter tail. The glibc build has a better median, because its allocator is better under contention, and a smaller binary, because it links the system libraries instead of carrying them.
The reason to pick musl isn’t the median. It’s that the artifact is one file with nothing underneath it, which is what makes the container the binary and the cold start a process exec.
What isn’t measured here
GraalVM is missing from these tables on purpose. A fair comparison would have to run the same handler, and this handler can’t run on GraalVM: the runtime’s native methods are ParparVM’s, so comparing would mean benchmarking a different server written against a different framework and reporting it as though the toolchains had been compared. That’s a benchmark worth building, and it isn’t this one.
Deploying it
The musl build is a single static file, so the container that carries it can be empty:
FROM scratch
COPY bench-linux-musl-arm64 /server
ENTRYPOINT ["/server"]
There is no base image to patch, because there is no base image. cn1:backend-package
builds for the machine it runs on; the cross-compiled targets
(musl-x86_64, musl-arm64, glibc-x86_64, glibc-arm64) are produced by
vm/backend/package.sh in the Codename One repository, which drives one builder
image per target.
For AWS Lambda, LambdaRuntime implements the custom runtime loop. The Lambda
Runtime API is a plaintext poll over loopback, so it needs no listening socket and
no TLS, and what it does need is exactly what a translated binary is good at.
Limits worth knowing
The class library is the Codename One runtime, not Java SE. A server dependency that assumes the full JDK won’t translate, and Maven Central isn’t the ecosystem this draws on.
Beans, injection, transactions, scheduling and metrics are resolved at build time, so what a runtime container discovers on its own — beans in a jar found by scanning, a proxy created for a class decided at run time — isn’t available. There is no starter ecosystem, and validation and error mapping are written by hand or generated from the REST contract.
Native packaging compiles Java sources and checks them against the backend’s class library. Kotlin sources aren’t wired into this packaging path yet. Application sources use Maven’s compiler
releaseorsource/target, or Gradle’scompileJava.options.releaseorsourceCompatibility/targetCompatibility. For example, setmaven.compiler.releaseto17or25, or setcompileJava.options.releaseto the corresponding value in Gradle. Use a JDK that supports the selected level. Maven defaults to its own JDK; Gradle usescompileJava’s Java toolchain. `cn1.backend.jdkcan select a different JDK (-Dfor Maven,-Pfor Gradle). The legacyJDK_8_HOMEoverride applies only when application and test sources both target Java 8. The backend libraries and generated wiring remain at Java 8 independently of the application’s language level. Records, pattern matching forinstanceof, and switch expressions can be used by application code. A newer language level doesn’t add Java SE APIs to the native runtime: unsupported API references fail packaging before translation. Pattern matching inswitchneeds a bootstrap the native translator doesn’t implement and fails packaging; useinstanceofbranches for native code instead. Compiled tests likewise honor Maven’stestSource/testTarget/testReleaseand Gradle’scompileTestJavasettings. Compiler arguments, including--enable-preview, are passed to application and test recompilation. Annotation processors on the class path run during those compilations unless disabled with the compiler’sprocsetting.A virtual thread parks on sockets and on nothing else. A PostgreSQL or MySQL query, a
Webcall and a TLS handshake all park it, and its host serves other connections meanwhile. SQLite, file access, resolving a host name andObject.wait()block the host thread that’s running them, and with one host per core, that many concurrent slow calls of that kind occupy every host while other connections wait. A server whose handlers spend their time in SQLite should size for that, or run the thread pool withCN1_HTTP_POLL_MODE=0.TLS runs on the thread pool, whatever the poll mode says. The TLS layer can’t park a read yet, and a blocking read on a virtual thread holds its host for the duration, so one idle TLS client per core would occupy every one of them. The server says so at startup when it makes that choice.
Native builds target Linux. Development happens anywhere a JVM runs.
WebSockets are RFC 6455 over HTTP/1.1. There is no permessage-deflate, so messages go out uncompressed no matter how compressible, and no RFC 8441, so a browser that reaches this server over HTTP/2 opens a second connection for its WebSocket rather than carrying it on the first. Both are what every client already falls back to.
wssworks on the packaged runtime through the same TLS the rest of the server uses, and not in the local loop, which terminates no TLS.
The reasons to choose this are cold start, footprint, deployment shape, and one language across the app and its server. If none of those matter for the service in front of you, use a JVM framework.